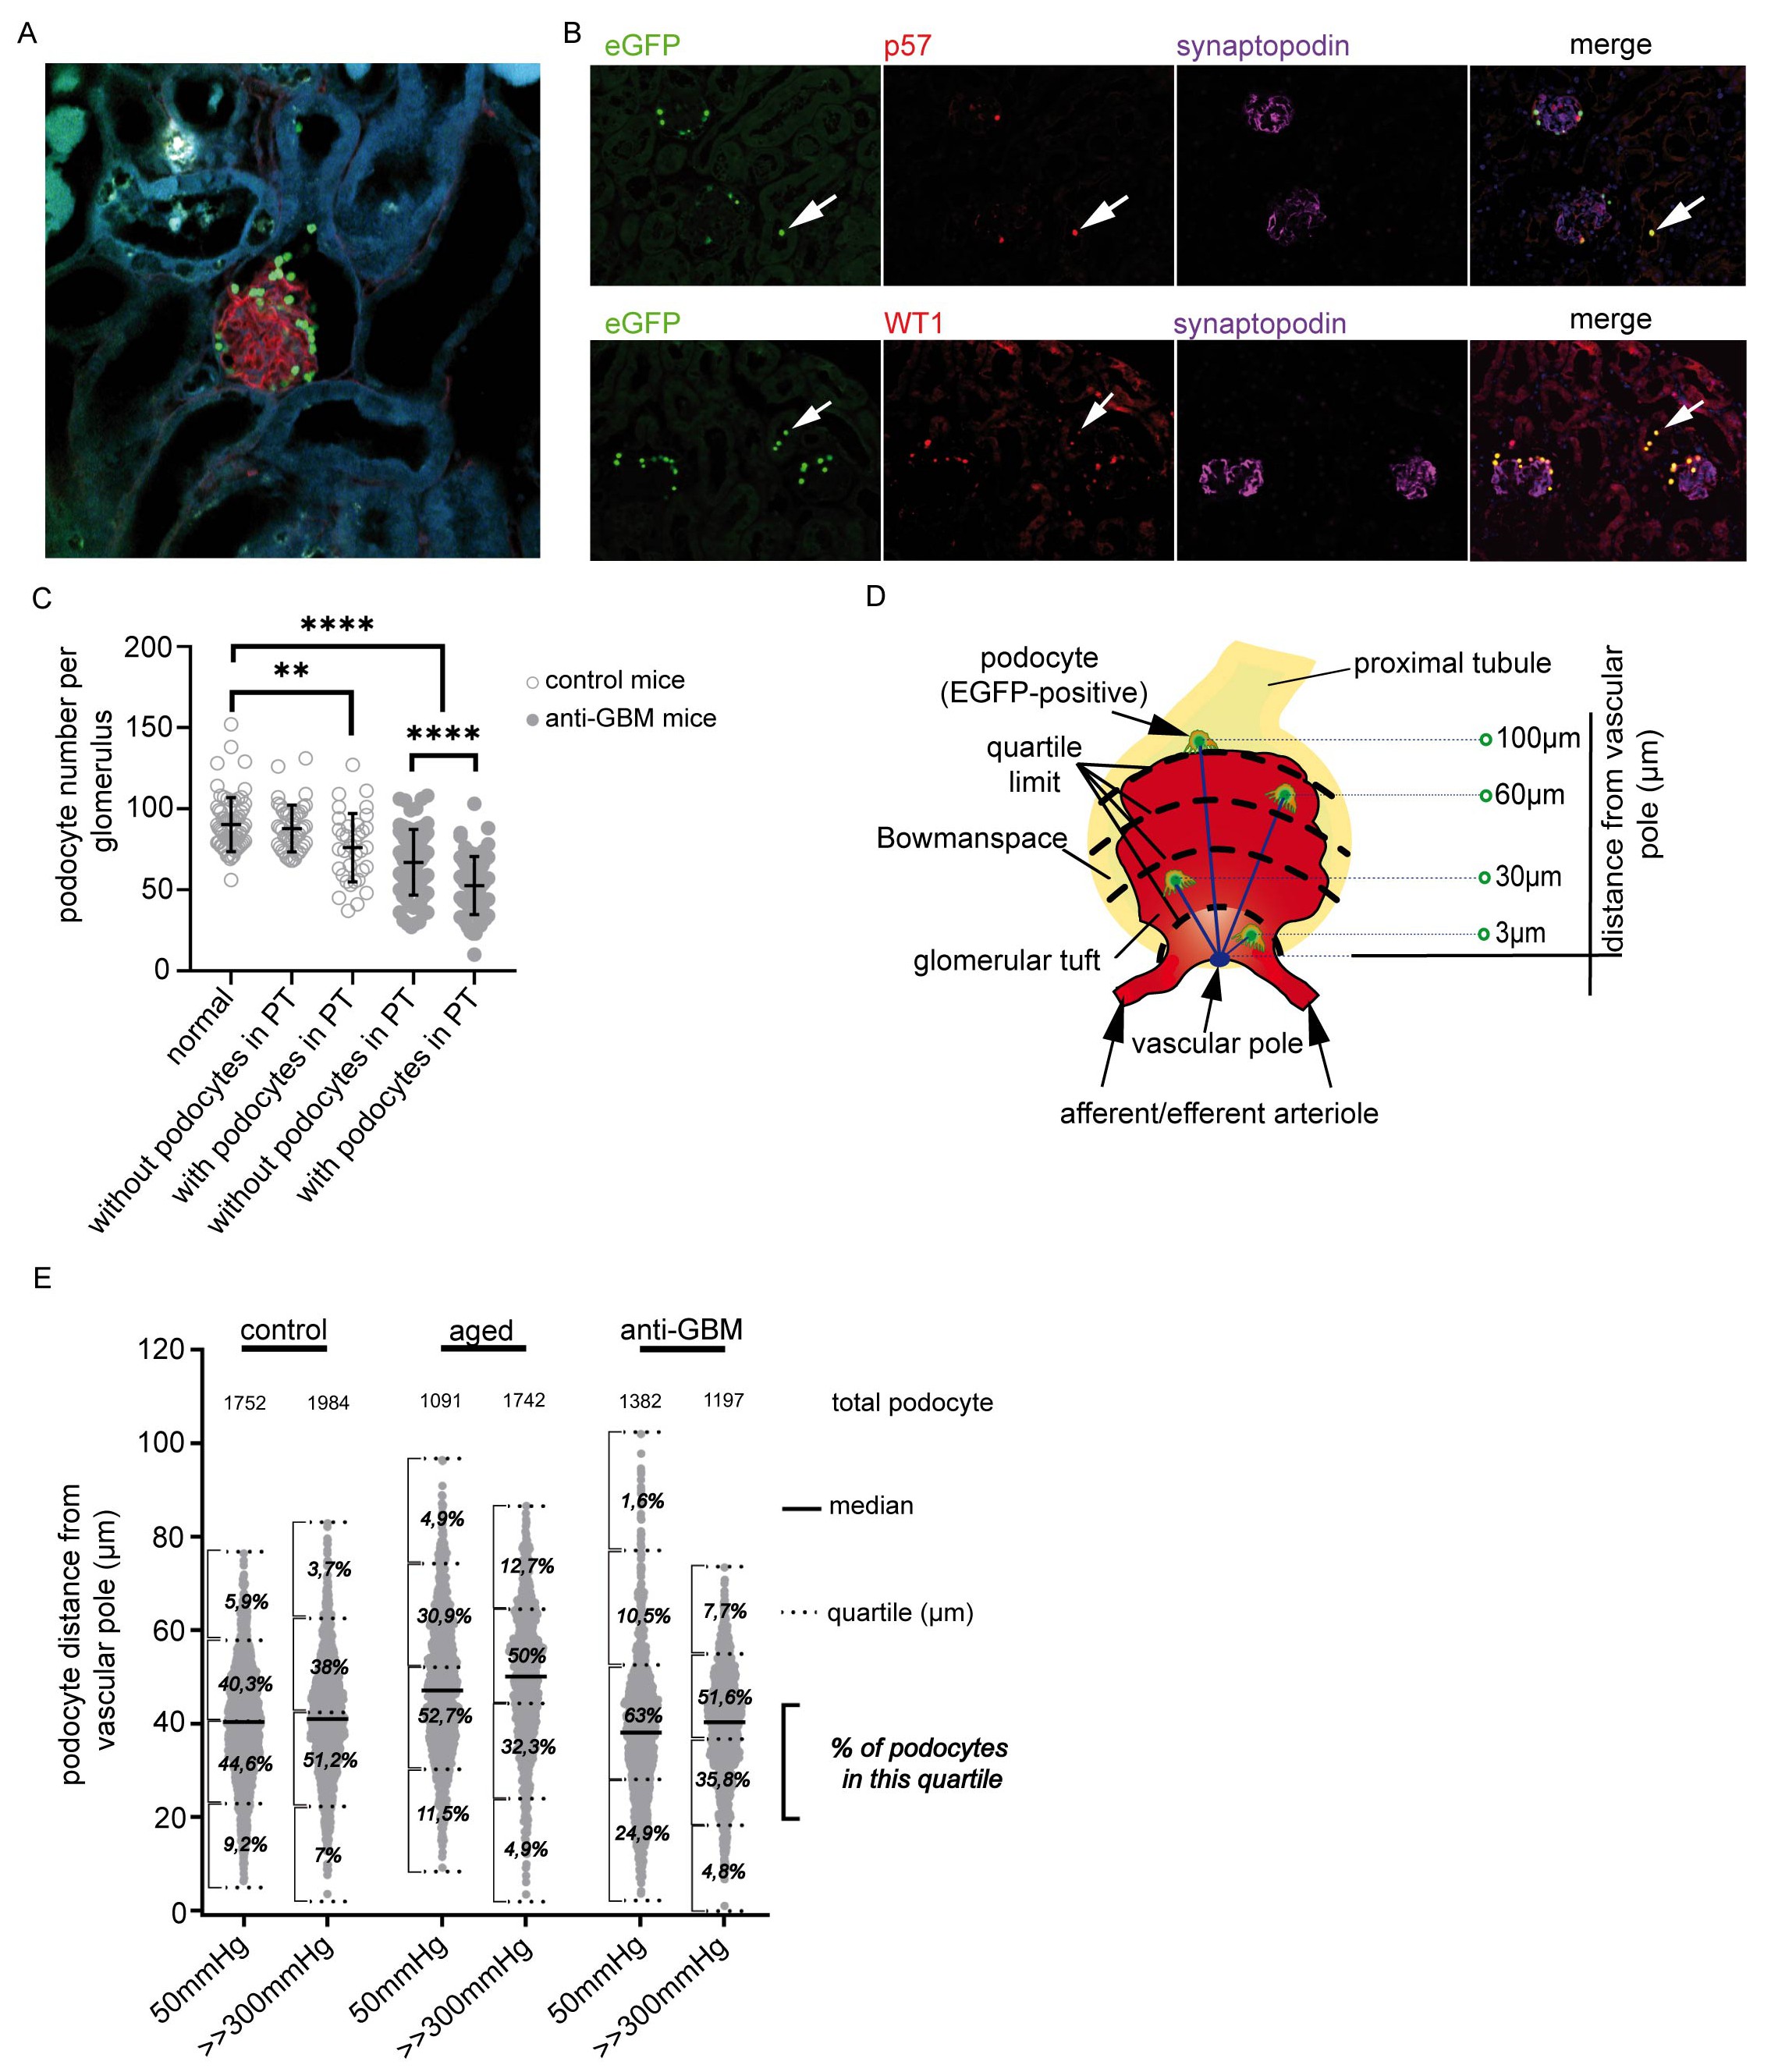
Fig. 4. Detection of podocytes in the adjacent prox. tubule. (A) Representative image showing eGFP+ podocytes (green) in the tubulus. (B) Immunofluorescence staining of podocytes co-labeled by the transgene histone-eGFP (green), and the endogenous podocyte markers p57 (red), wt-1 (red) and synaptopodin (purple). (C) Association of the number of podocytes per glomerulus with the number of podocytes identified in the tubule (n=81 glomeruli from control mice, n= 41 glomeruli form aged mice and n= 81 glomeruli from anti-GBM mice). For multiple comparisons ANOVA was used. ****P<0.0001, **P< 0.01 and ns = not statistically significant; error bars represent means ± SD; in the graph each circle represents 1 podocyte; (D) schematic showing how distance of podocytes from vascular pole was calculated. (E) Distances of individual podocytes from the vascular pole. The individual distances from the vascular pole were separated into quartiles.